


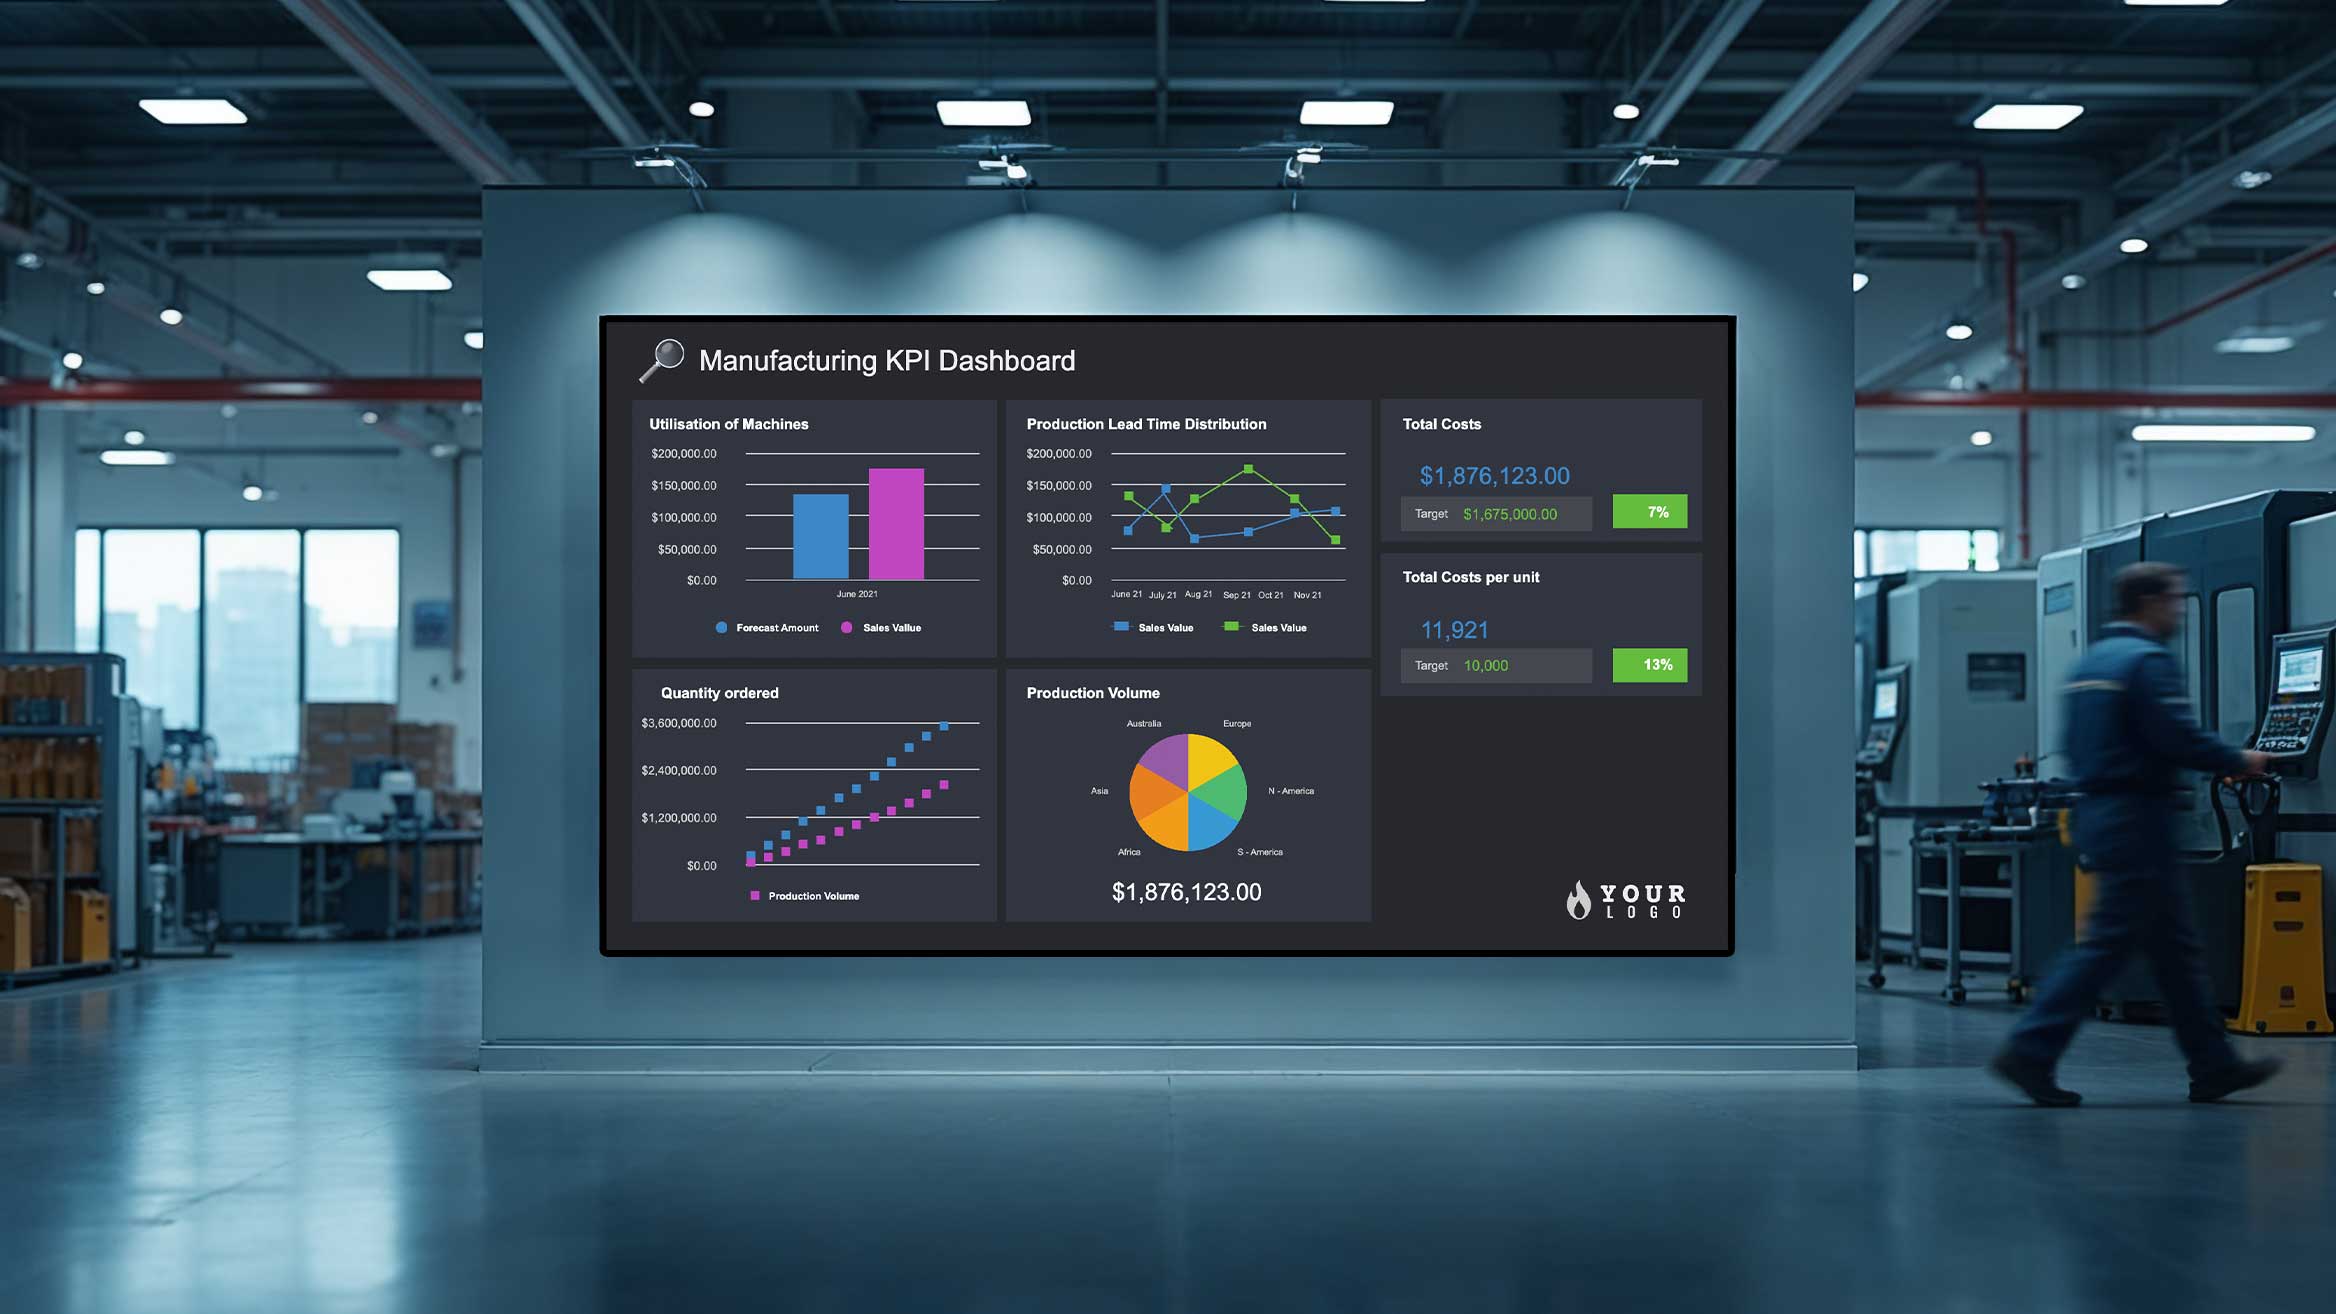
Manufacturing KPIs dashboard for real-time production visibility
Use a manufacturing KPIs dashboard to keep production teams aligned with real-time metrics, targets, and operational performance.
7,500+ reviews from


Trusted by over 65,000 companies of every size, across 150+ countries










46%
FIND DIGITAL SIGNAGE ENGAGING
65%
SHOW POSITIVE SIGNAGE PERCEPTION
56%
ARE MOTIVATED BY DIGITAL SIGNAGE
Enhance your manufacturing dashboard with smart apps
Pick the best apps and keep your manufacturing KPI dashboards live on every screen.
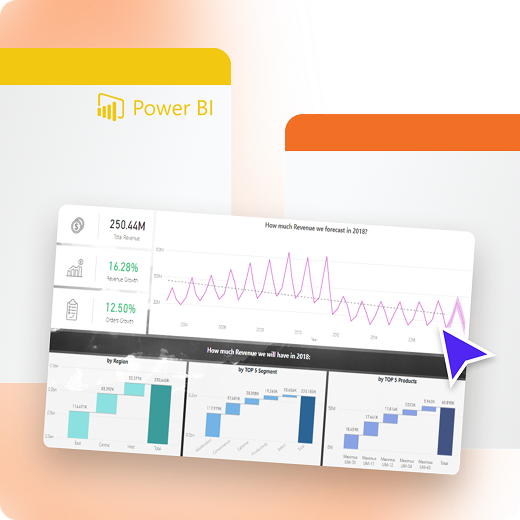
Power BI
Display manufacturing KPIs and reports with Power BI
Make performance data visible and keep teams aligned with live metrics
Display real-time production and performance metrics
Show interactive charts and dashboards on any screen
Use familiar Power BI reports built by your teams
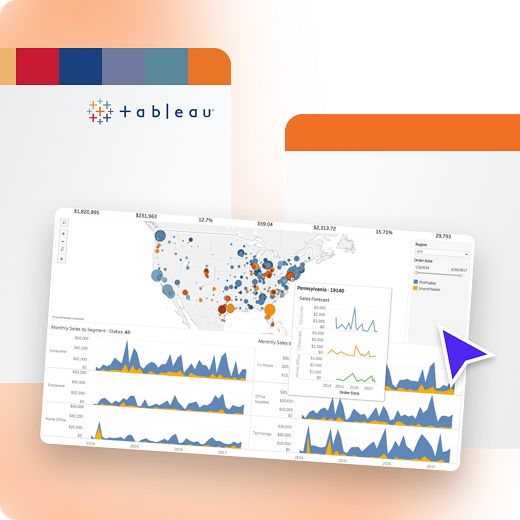
Tableau
Share manufacturing insights with Tableau
Make data-driven decisions easier with trusted Tableau KPIs dashboards.
Display live production, quality, and efficiency metrics
Show interactive Tableau dashboards on any screen
Use existing Tableau views built by your data teams
Grafana
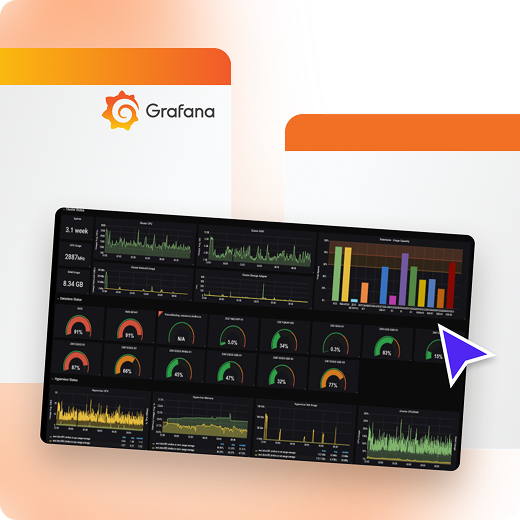
Monitor live manufacturing metrics with Grafana
Track real-time operational data and system metrics on your screens
Visualize live machine, process, and system metrics
Display Grafana app dashboards live on screens
Keep teams aware of changes and performance trends
Ticker
Highlight critical updates with the Ticker App
Keep teams informed with continuous, easy-to-read updates
Share KPIs, alerts, and status updates with a Ticker App
Keep important messages visible without full-screen takeovers
Reduce missed updates with persistent on-screen information
Benefits of KPIs dashboard for manufacturing industry
Manufacturing signage turns KPIs into shared visibility, helping teams track performance, respond faster, and stay aligned
Get started
Real-time visibility
See production KPIs as they update in real time
Faster decisions
Spot issues early and act before delays escalate
Team alignment
Keep operators and managers focused on shared goals
Operational focus
Reduce distractions with purpose-driven displays
Consistent metrics
Ensure everyone works with the same trusted data
Actionable displays
Use dashboard signage to turn KPIs into action
A production KPI dashboard trusted by manufacturers
Get started for Free
Benjamin D.
CTO
“User-friendly: The platform is straightforward, making it easy for anyone on our team to create and manage content. Remote management: Being able to control screens remotely from a centralized dashboard is extremely convenient. The setup was very smooth. Affordable: Yodeck offers competitive pricing, which makes it accessible for small to medium-sized businesses.”

November 8, 2025
Amanda F.
Medical Staff Coordinator
“The initiative demonstrates exceptional alignment with strategic objectives, delivering measurable impact across operational efficiency and stakeholder engagement. Execution was marked by precision and adaptability, ensuring compliance with regulatory standards while advancing organizational priorities.”
November 24, 2025
Gabby T.
Credentialing Coordinator
“The interface is very user-friendly. Uploading content, scheduling playlists, and managing screens is quick – even for people who aren’t tech-savy. You can control every screen from anywhere. Update content across multiple locations in seconds without having ot physically touch the device.”
November 25, 2025
Build smarter KPI displays with 160+ free apps
Connect KPI displays to live data sources, dashboards, and feeds to keep performance visible and up to date.


























































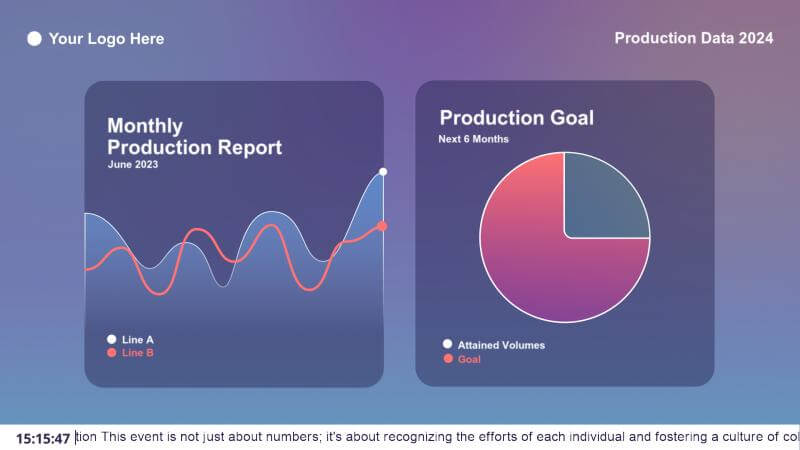
Templates for KPI screens designed for real-time data
Browse templates
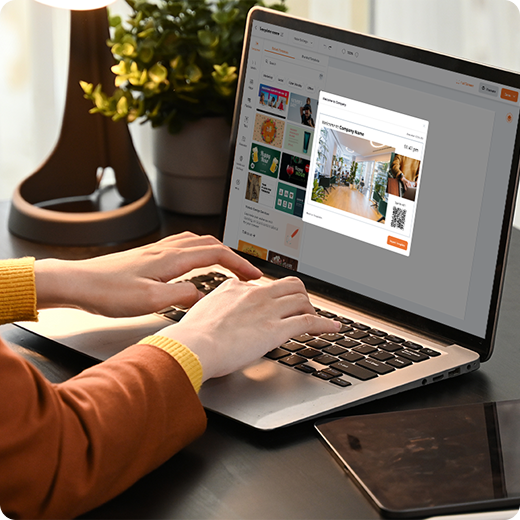
Why choose Yodeck KPI dashboard
For single or multiple factories, Yodeck scales while staying simple to run. Teams use one digital signage software to keep KPI dashboards consistent everywhere.
Yodeck is designed for manufacturing environments. KPIs stay visible and reliable in production areas, control rooms, and offices.
Connect Power BI, Tableau, Grafana, and other apps directly to screens. Your existing dashboards become shared, real-time visibility.
Operators get clear KPIs without effort, while IT benefits from stability and control. Updates are easy, maintenance is minimal, and performance stays predictable.
Manufacturing KPIs Dashboard: FAQs
How does digital signage enhance manufacturing dashboards?
Digital signage turns a static dashboard for manufacturing industry teams into a live communication tool across the facility. Instead of being accessible only to managers, KPIs can appear on shared screens in production areas, shift handover points, break rooms, and operations offices. This boosts transparency, speeds response, reduces unnecessary meetings, and aligns production, maintenance, quality & supply teams in real time.
What are examples of manufacturing dashboard types?
Common manufacturing dashboard examples include:
- Production dashboards (output, cycle time, availability)
- Quality dashboards (defects, yield, rework)
- Maintenance dashboards (MTBF, MTTR, open tickets)
- Safety dashboards (incident rates, compliance)
- Supply chain dashboards (inventory, supplier OTIF)
Each dashboard supports a different operational objective.
Why display a production KPI dashboard on factory screens?
A production KPI dashboard on digital screens gives teams instant visibility without leaving their workstations. When targets slip or downtime spikes, teams can react immediately rather than wait for end-of-shift reports. This improves shift alignment, reduces communication gaps, and reinforces accountability by keeping performance visible throughout the day.
What metrics should a manufacturing metrics dashboard include?
The key is clarity: focus on 5–10 actionable KPIs per screen to avoid overload and support fast decision-making, such as:
Maintenance status: Current equipment service condition
- OEE: Overall machine performance score
- Downtime by cause: Reasons machines stopped running
- First-pass yield: Products correct first attempt
- Scrap rate: Percentage of wasted materials
- Takt time: Required production pace
- On-time delivery: Orders shipped by deadline
Can we display Tableau or Power BI dashboards on factory KPI screens?
Yes. Yodeck supports Tableau KPI dashboard and Power BI KPI dashboard integrations, allowing you to display live reports directly on screens. You can also showcase a Power BI manufacturing dashboard in full-screen mode or within layouts that combine KPIs with safety alerts, shift updates, or HR announcements for broader operational visibility.
Is manufacturing signage difficult to maintain?
No. Modern manufacturing signage platforms are cloud-based and IT-light. Once dashboards are connected, updates sync automatically. If a screen reboots or temporarily loses connectivity, playback resumes without manual resets. This level of reliability makes KPI displays well-suited for production environments, where minimizing downtime and avoiding unnecessary technical complexity are essential.
Does the manufacturing KPI dashboard work during an internet outage?
Reliability is paramount in a 24/7 industrial environment. Yodeck’s manufacturing dashboard software caches all layout assets and media locally on the player, so the screen will never go blank. It will continue to display the last cached data point and all other dashboard signage content (like safety videos) until the connection is restored.
Can dashboards be managed across multiple factories?
Yes. Yodeck is one of the best platforms for managing global manufacturing KPIs and dashboards because it supports Workspaces and centralized cloud control. Corporate teams can push standardized KPI displays globally, while local plants adjust specific metrics. This ensures consistent reporting across regions without sacrificing local operational flexibility.
How much does manufacturing dashboard software cost?
Manufacturing dashboard software cost depends mainly on how many KPI screens you need across lines, departments, or sites. Yodeck uses straightforward per-screen digital signage pricing starting at $8€8£7CA$12AU$13 per screen per month so that you can begin with a few displays and scale predictably. Compared to manual reporting & printed boards, most teams see fast ROI through faster decisions and fewer meetings.
How can digital signage improve operations in manufacturing facilities?
Manufacturing digital signage improves operations by making the right information visible, in real time, where teams actually work.
- Implement Wayfinding to guide staff, contractors, and visitors safely across large facilities
- Share SOPs, safety, maintenance, and shift updates via Manufacturing Information Displays
- Add TV Dashboard Displays for real-time dashboards in shared areas
- Use Internal Communications for plant-wide announcements and alignment

